
CrimeGrade™ safety ratings for every neighborhood in America
See how safe any city or ZIP code is. Every neighborhood in the country gets a CrimeGrade™ from A+ to F.
Every state, every neighborhood. Or explore featured cities.
Crime risk for every business location, finer than a city block
Retail, security and risk teams get a CrimeGrade™ score for each crime at each store's address, compared with the typical store of its type. Every location sits on one national scale, so security budgets, staffing and site choices can follow the risk.
Crime scores tuned to your own losses
- Custom scores weighted to your own loss records
- An evaluation on your own locations before you commit
- A switch from another provider without rebuilding your risk models
- Portfolio scoring and an API, by arrangement
Safer than 43% of U.S. neighborhoods.
A full CrimeGrade™ report for any place
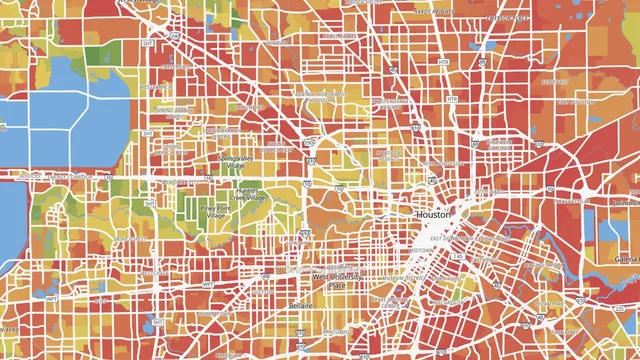
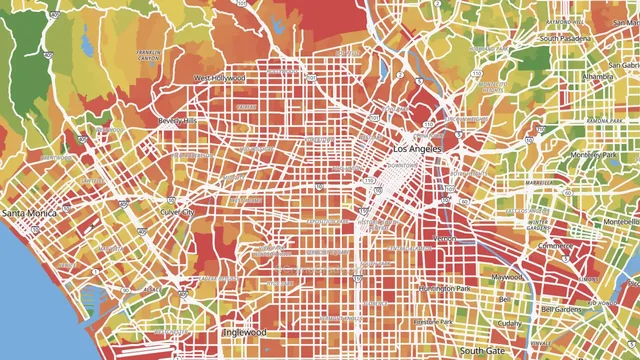
Every search returns a graded report card: how a place scores overall, how it breaks down by type of crime, and how crime changes from one neighborhood to the next.
- An overall CrimeGrade™ from A+ to F, with a safety score out of 1,000
- Separate grades for violent and property crime
- Neighborhood maps for each crime
- The yearly cost of crime per resident and per household
- The safest and least safe areas nearby
Updated November 2026. CrimeGrade™ updates its data once a year.
How CrimeGrade™ works
A CrimeGrade™ turns the crimes reported to police into one letter, from A+ for the least crime to F for the most. Every place is graded on one national scale, so a B in one city means the same as a B anywhere else.
Built from police reports
Every grade starts from crimes reported to police, from FBI records and state and city crime data. Where police data has gaps, CrimeGrade™ estimates crime the same way it does everywhere else, so every area carries a grade.
Fair to busy places
Each crime is measured against what it affects: people for assaults, homes for burglaries, parked cars for car thefts. A busy shopping street keeps its own grade, and the quiet blocks around it keep theirs.
Weighted by harm
Each crime counts by what it costs victims and the community, from peer-reviewed research (McCollister, French and Fang, 2010). A robbery counts far more than a theft.
CrimeGrade™ ratings in major cities
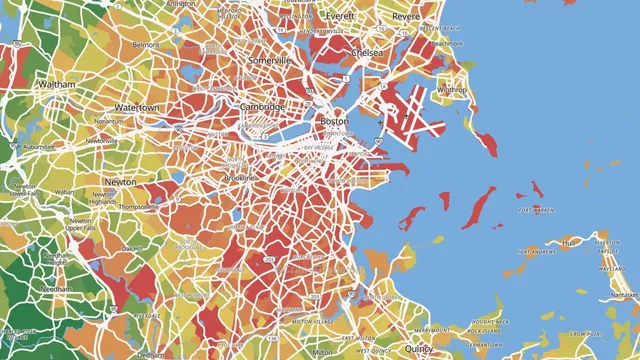
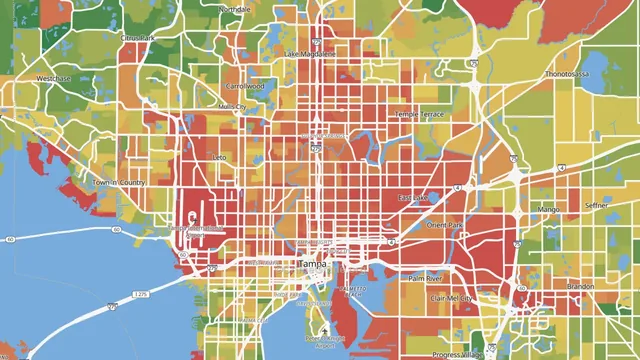
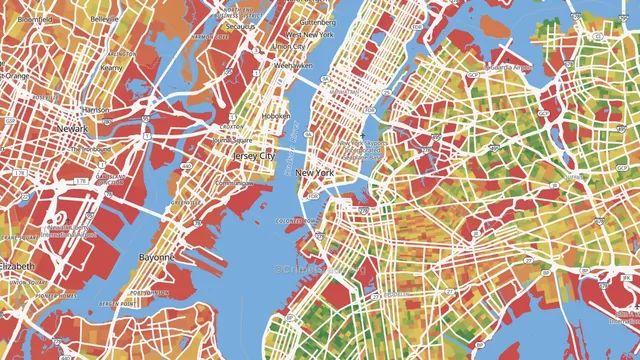
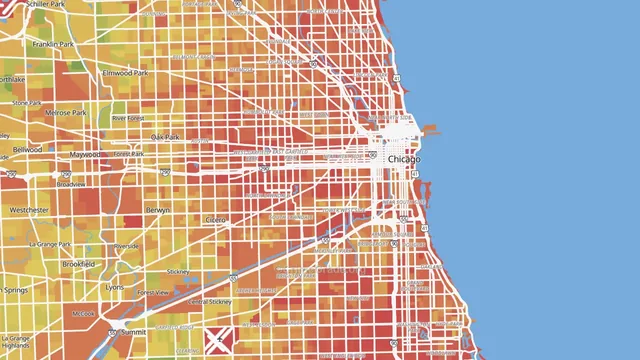
Six major metros, best to worst, so you can see the scale at work. Or search any place above.
Independent reviews of home security systems
Compare home security systems and find the one that fits your home and your neighborhood.
CrimeGrade™ may earn a commission when you choose a provider through these links. Commissions do not change the recommendations.
CrimeGrade™
Safety ratings for every neighborhood in America.