The Best Home Security Systems in Benbow, CA
Are you looking for the best home security systems in Benbow, CA? Using Crime Grade's exceptional crime data that is accurate down to the neighborhood, we have analyzed Benbow, CA home security system options in a way no other source has been able to do. See why
A property crime is committed in Benbow every 34 days 22 hours, and nationwide, your home is 300% more likely to be burglarized without a home security system. Benbow experiences 16.08 property crimes per 1000 people and 5.440 incidents of vandalism per 1000 people in the typical year. A home security system will protect you when you’re at home or away, 24 hours a day.
Home Security Companies Available in Benbow, CA
Best Overall
SimplisafeWe believe Simplisafe is the best home security system for residents of Benbow. The combination of a high amount of renters (42%) and education level (29% of residents have a college degree) makes Simplisafe our top pick.
Affordable Option
RingRing Alarm is a disrupter whose incredibly low monitoring fees (as low as 1/10th the price of larger and better-known companies) and sharp equipment has already made them a household name.
Best Reputation
ADTCompelling history and top quality security and smart home products. If you're willing to pay for it, you will get a top notch product.
Do You Need a Home Security System in Benbow, CA?
Choosing a home security system can seem overwhelming. We’re here to help break down what to consider when living in Benbow, CA. We’ll compare different crime rates and weather along with advanced features that make you feel safer and make your life easier.
Why Crime Grade?
Crime Grade has the most robust and accurate nationwide crime model available. In addition, our data is granular enough to identify and compare crime statistics to the neighborhood level. This puts us in the unique position of being able to evaluate the home security needs of people in a particular city rather than making a general assessment. So read on to see what's unique about Benbow, CA and our home security system recommendations that result from that.
Property Crime in Benbow, CA
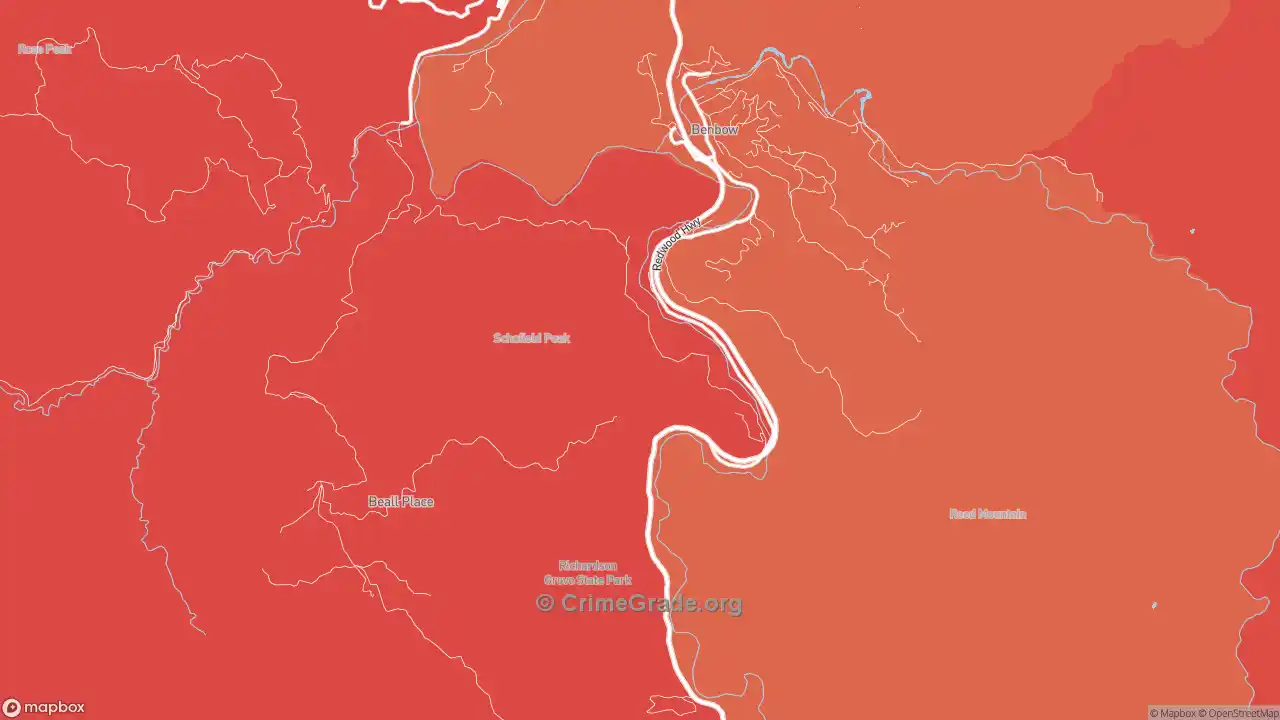
Our analysis gives Benbow a property crime grade of: C. Benbow is in the 56th percentile of safety, meaning 56% of cities in California are safer and 44% are more dangerous. Please visit our Benbow crime map for details on how this is calculated and what it means.
Crime Grades
Property crime is highest in the eastern part of Benbow, with your chances of being a victim of 1 in 59. Compare this to the central part of the city, where crime is lower, and your chances of being a victim are 1 in 67.
B
D- |
|
C |
|
Other Crime Grade |
A |
A crime occurs every 34 days 22 hours (on average) in Benbow, CA.
Your home is 300% more likely to be robbed with no home security system.
So, is Benbow safe? Compared to all of California, Benbow is rated safer than the average California city, which has a property crime rate of 37.66 per 1000. Looking at burglary, we see a different pattern, where Benbow, with its burglary rate of 10.62 per 1000, is as safe as the average California city.
In addition, Benbow is lower than other cities with similar populations for property crime. The table below shows property crime rates and level of occurrence in Benbow, CA.
Crime Type |
Crime Rate (per 1000 residents) |
Avg Number of Crimes per year in Benbow, CA |
Avg Crimes Committed Per Week |
|---|---|---|---|
Theft |
2.982 |
1 |
0.0 |
Vehicle Theft |
2.006 |
0 |
0.0 |
Burglary |
10.62 |
2 |
0.0 |
Arson |
0.4756 |
0 |
0.0 |
Weather and Climate in Benbow, CA
As strange as it might sound, some home security system features can be more or less important based on the climate you live in.
Home Security Fire Sensors in Benbow, CA
Hotter temperatures can lead to higher risk of fires in the home. The average temperature in Benbow, CA is 63.35 degrees, reaching 99.91 degrees in the hottest months like July & August. This temperature has increased compared to 1990, when the hottest month reached 69.43 degrees in July.
Home age is another factor in determining fire risk, primarily due to electrical issues. The average home in Benbow was built in 1978, which is about average compared to the national average of 1978 and is much older than the average home in California build in 1977.
Between hotter seasonal temperatures and average home ages in Benbow, you can judge how important fire sensors and immediate response may be. A combination of smoke detectors, CO2 sensors, and fire alarms connected to a home security system can make that response as swift as possible, whether you’re at work or on vacation.
Home Security Flood Sensors in Benbow, CA
Benbow, CA gets an average rainfall of 0.6" per year. This is higher than the average of 0.2" for California.
With the risk of flooding and burst pipes, a flood sensor can alert you and authorities as soon as possible. Even a few hours make the difference between an easy restoration and long-term water damage.
Home Security Freeze Sensors in Benbow, CA
The year a home was constructed can also contribute to the risk of damage from cold weather. The average home in Benbow is 45 years old, and seasonal temperature changes have had much more time to cause stress on the home compared to the average California home that's 46 years old and about the same amount of time than the national average of a 45-year-old home.
Temperature fluctuations will weaken the structure and foundation of the home, cold temperatures can cause pipes to leak or burst, and if it snows that can cause additional stress on the roof. However, freeze sensors are not an expensive addon. After assessing your Benbow home, you can make a more informed decision if they would be a suitable addition to your home security system.
Cost of Home Security Systems in Benbow, CA
To identify the final cost of a home security system for your Benbow home, we must determine some of your preferences.
Self-Monitored or Professionally Monitored?
Any home security system you pick will offer a selection of equipment including entry sensors, cameras, etc. The question is, do you actually want to self-monitor your system? If like 42.00% (87) of people in Benbow, you are a renter, you might prefer a self-monitored home security system. On the other hand, 58.00% or 121 of Benbow residents own their homes and may be more likely to consider a professionally monitored system to protect their property.
Whether you rent or buy, how well can you monitor your system on your own? For example, if you're one of the 19% of people who commute an average of 25 minutes to work in or around Benbow, can you immediately receive notifications on your phone, check cameras in meetings or while working, and call the police if needed?
If not, you might want a professionally monitored system where a company is available 24/7 to respond, whether on vacation or at work. Please see our comprehensive guide on the best home security systems for a complete comparison.
Self-Installed vs. Professional Installation
Most providers have great self-installation options, so if you're handy or tech-savvy, like the 0% of Benbow residents working in computer engineering and science, self-installation can be a great option.
Alternatively, when your security system is installed professionally, you can ensure that your equipment is placed correctly and will function without any problems. That peace of mind is valuable for people willing to spend the extra money.
Residents of Benbow tend to have a lower median household income than nearby cities, earning $55,768 annually. In addition, 28.6% of residents have a college degree or higher, compared to 32.9% in the United States.
If you're a homeowner, do you have more to protect? The median home value in Benbow is $482,560. Compared to the median home value in California of $648,235, your home value will probably be lower. With their larger lots, single-family homes tend to be more isolated from view and a tempting target for burglars.
Find an in-depth review of installation options in our best home security systems guide.
Police Stations Near Benbow, CA
There are 0 police stations within the boundaries of Benbow, and 1 within 5 miles. Within 50 miles of the Benbow center, there are 17 police stations. Compared to other cities, police response times in Benbow may be about average. When response times are fairly typical, every second your security system saves in reporting a crime will improve the police response.
| Humboldt County Sheriff's Department 648 Locust St Garberville, CA 95542 (707) 923-2761 |
Highway Patrol 30 West Coast Road Redway, CA 95560 (707) 923-2155 |
Cahto Tribal Police Department 300 Cahto Drive Laytonville, CA 95454 (707) 984-6460 |
Home Security and Property Crime in Cities Near Benbow, CA
Nearby City | Property Crime Grade | Overall Crime Grade | Safer than Benbow, CA? |
|---|---|---|---|
| Garberville, CA | C- | C+ | less safe |
| Piercy, CA | F | F | less safe |
| Redway, CA | C | B | about as safe |
| Briceland, CA | C+ | B+ | about as safe |
| Harris, CA | D- | D- | less safe |
| Phillipsville, CA | C | C+ | about as safe |
| Whitethorn, CA | D+ | C+ | less safe |
| Alderpoint, CA | D- | D- | less safe |
| Ettersburg, CA | B- | B | more safe |
| Miranda, CA | C+ | B- | more safe |
Home Security and Property Crime in Cities Similar to Benbow, CA
Nearby City | Property Crime Grade | Overall Crime Grade | Safer than Benbow, CA? |
|---|---|---|---|
| Snyder, IL | D+ | D+ | less safe |
| Hutchinson, NJ | A | B- | more safe |
| Huntsville, KY | C+ | B | about as safe |
| Shattuc, IL | C+ | B+ | about as safe |
| Shawmut, MT | D- | D- | less safe |
| Hingham, MT | D- | D- | less safe |
| Silver Bay, NY | D+ | B+ | less safe |
| Half Mound, KS | D- | D+ | less safe |
| Grayling, AK | C- | C- | less safe |
| Ibapah, UT | F | F | less safe |
Summarizing Home Security Considerations in Benbow, CA
Deciding whether you need a home security system in Benbow, CA can be a complicated decision. We've used distrinctive property crime statistics and varying environment factors about the city to help us make an objective recommendation for most residents. Leveraging CrimeGrade.org's uniquely robust and granular crime data, we've scrutinized the options for home security systems, tailoring them to the unique needs and context of Benbow residents.
Combining the property crime Grades, demographic information, and local climate conditions for advanced home security features gives us some companies that stand out.
Simplisafe, Ring, and ADT have emerged as the top choices for Benbow residents due to their distinctive offerings and reliability, each appealing to varied preferences and budget ranges of homeowners and renters alike. Notably, factors such as Benbow's climate, housing age, and average income levels further steer the home security considerations.
Property Crime Insights
- A property crime occurs approximately every 34 days 22 hours in Benbow.
- The city experiences 16.08 property crimes and 5.440 vandalism insidents per 1,000 people annually.
- Benbow's property crime grade stands at an 'C', comparably safer than other California {{place_type__plural_lower}}.
Noteworthy Security Companies
- Simplisafe: We believe Simplisafe is the best home security system for residents of Benbow. The combination of a high amount of renters (42%) and education level (29% of residents have a college degree) makes Simplisafe our top pick.
- Ring: Ring Alarm is a disrupter whose incredibly low monitoring fees (as low as 1/10th the price of larger and better-known companies) and sharp equipment has already made them a household name.
- ADT: Compelling history and top quality security and smart home products. If you're willing to pay for it, you will get a top notch product.
Climate Considerations for Security
- Fire sensors could be worth considering, since the average temperature reaches 99.91 degrees in the peak months of July & August.
- Flood sensors are also worth considering due to the 0.6" of average yearly rainfall and house age of 45 years.
Self vs. Professional Monitoring & Installation
- 42.00% of Benbow residents are renters, potentially inclining towards self-monitored systems.
- Given the 19% of commuters, professional monitoring might offer valuable peace of mind.
- Considering Benbow's lower household median income of $55,768 and 28.6% college-degree holding populace, investment in professional installation and advanced system features might be favorable.
Local Police Presence
- Benbow hosts 0 police stations within it's borders, potentially influencing response times.