The Best Home Security Systems in Downtown Lynnwood, Lynnwood, WA
Are you looking for the best home security systems in Downtown Lynnwood, Lynnwood, WA? Using Crime Grade's exceptional crime data that is accurate down to the neighborhood, we have analyzed Downtown Lynnwood, Lynnwood, WA home security system options in a way no other source has been able to do. See why
A property crime is committed in Downtown Lynnwood every 1 day 17 hours, and nationwide, your home is 300% more likely to be burglarized without a home security system. Downtown Lynnwood experiences 45.61 property crimes per 1000 people and 10.31 incidents of vandalism per 1000 people in the typical year. A home security system will protect you when you’re at home or away, 24 hours a day.
Home Security Companies Available in Downtown Lynnwood, Lynnwood, WA
Best Overall
RingWe believe Ring is the best home security system for renters. 63% of residents in Downtown Lynnwood rent rather than own their homes. Additionally, the median income is $58,831, about comparable to the national average, therefore it is important that Ring is also affordable, with monitoring optional.
Best Reputation
ADTCompelling history and top quality security and smart home products. If you're willing to pay for it, you will get a top notch product.
No Contract Pick
SimplisafeThese guys offer the best all-round balance of equipment, monitoring, customer service, and price. They’re reliable and the keep your home safe—it’s a fairly comfortable #1 spot.
Do You Need a Home Security System in Downtown Lynnwood, Lynnwood, WA?
Choosing a home security system can seem overwhelming. We’re here to help break down what to consider when living in Downtown Lynnwood, Lynnwood, WA. We’ll compare different crime rates and weather along with advanced features that make you feel safer and make your life easier.
Why Crime Grade?
Crime Grade has the most robust and accurate nationwide crime model available. In addition, our data is granular enough to identify and compare crime statistics to the neighborhood level. This puts us in the unique position of being able to evaluate the home security needs of people in a particular neighborhood rather than making a general assessment. So read on to see what's unique about Downtown Lynnwood, Lynnwood, WA and our home security system recommendations that result from that.
Property Crime in Downtown Lynnwood, Lynnwood, WA
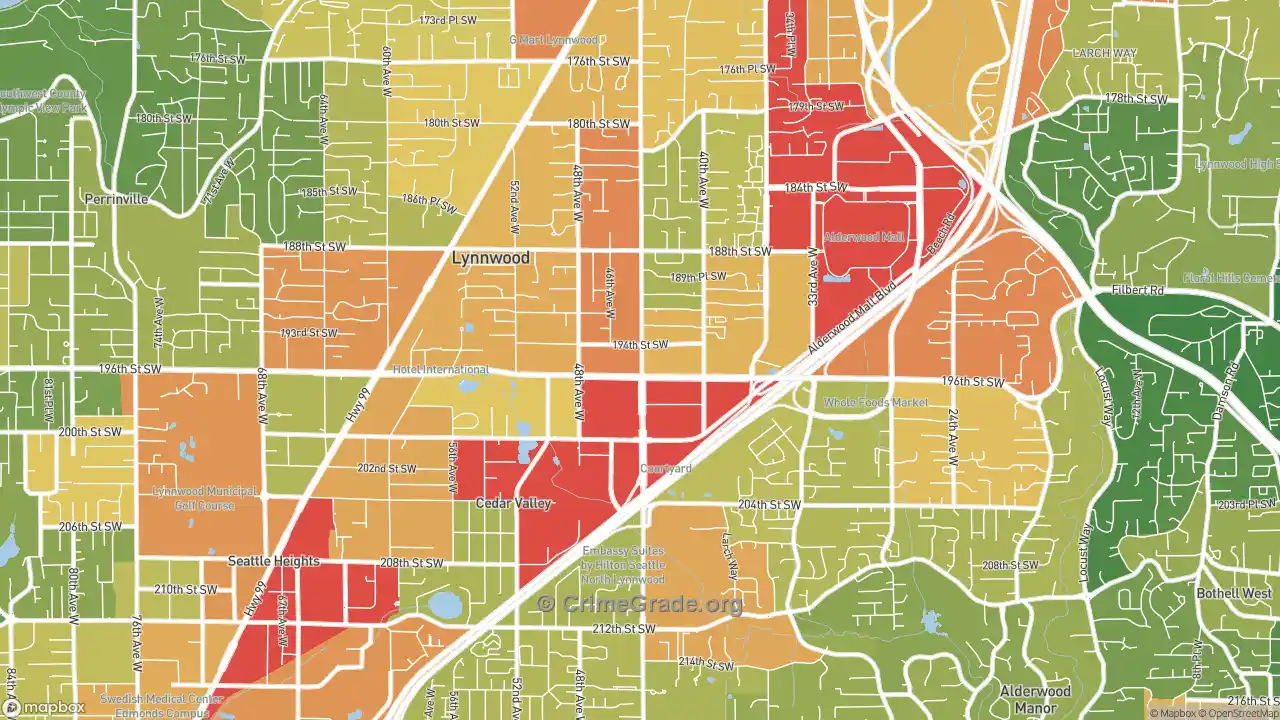
Our analysis gives Downtown Lynnwood a property crime grade of: D. Downtown Lynnwood is in the 81st percentile of safety, meaning 81% of cities in Lynnwood are safer and 19% are more dangerous. Please visit our Downtown Lynnwood crime map for details on how this is calculated and what it means.
Crime Grades
Property crime is highest in the southwestern part of Downtown Lynnwood, with your chances of being a victim of 1 in 16. Compare this to the northwestern part of the neighborhood, where crime is lower, and your chances of being a victim are 1 in 40.
D
C- |
|
D |
|
Other Crime Grade |
D+ |
A crime occurs every 1 day 5 hours (on average) in Downtown Lynnwood, Lynnwood, WA.
Your home is 300% more likely to be robbed with no home security system.
So, is Downtown Lynnwood safe? Compared to all of Lynnwood, Downtown Lynnwood is rated less safe than the average Lynnwood neighborhood, which has a property crime rate of 32.89 per 1000. Looking at burglary, we see a different pattern, where Downtown Lynnwood, with its burglary rate of 5.343 per 1000, is as safe as the average Lynnwood neighborhood.
In addition, Downtown Lynnwood is higher than other neighborhoods with similar populations for property crime. The table below shows property crime rates and level of occurrence in Downtown Lynnwood, Lynnwood, WA.
Crime Type |
Crime Rate (per 1000 residents) |
Avg Number of Crimes per year in Downtown Lynnwood, Lynnwood, WA |
Avg Crimes Committed Per Week |
|---|---|---|---|
Theft |
29.70 |
138 |
2.7 |
Vehicle Theft |
10.50 |
49 |
0.9 |
Burglary |
5.343 |
25 |
0.5 |
Arson |
0.0675 |
0 |
0.0 |
Weather and Climate in Downtown Lynnwood, Lynnwood, WA
As strange as it might sound, some home security system features can be more or less important based on the climate you live in.
Home Security Fire Sensors in Downtown Lynnwood, Lynnwood, WA
Home age is another factor in determining fire risk, primarily due to electrical issues. The average home in Downtown Lynnwood was built in 1973, which is about average compared to the national average of 1978 and is much older than the average home in Lynnwood build in 1985.
Between colder seasonal temperatures and average home ages in Downtown Lynnwood, you can judge how important fire sensors and immediate response may be. A combination of smoke detectors, CO2 sensors, and fire alarms connected to a home security system can make that response as swift as possible, whether you’re at work or on vacation.
Home Security Flood Sensors in Downtown Lynnwood, Lynnwood, WA
Downtown Lynnwood, Lynnwood, WA gets an average rainfall of 0.8" per year. This is similar to the average of 0.8" for Lynnwood.
With the risk of flooding and burst pipes, a flood sensor can alert you and authorities as soon as possible. Even a few hours make the difference between an easy restoration and long-term water damage.
Home Security Freeze Sensors in Downtown Lynnwood, Lynnwood, WA
Downtown Lynnwood, Lynnwood, WA reaches an average of 40.98 degrees in its cold months of December & January. This temperature has increased compared to 1990, when the coldest month reached 36.13 degrees in December.
The year a home was constructed can also contribute to the risk of damage from cold weather. The average home in Downtown Lynnwood is 50 years old, and seasonal temperature changes have had much more time to cause stress on the home compared to the average Lynnwood home that's 38 years old and about the same amount of time than the national average of a 45-year-old home.
Temperature fluctuations will weaken the structure and foundation of the home, cold temperatures can cause pipes to leak or burst, and if it snows that can cause additional stress on the roof. However, freeze sensors are not an expensive addon. After assessing your Downtown Lynnwood home, you can make a more informed decision if they would be a suitable addition to your home security system.
Cost of Home Security Systems in Downtown Lynnwood, Lynnwood, WA
To identify the final cost of a home security system for your Downtown Lynnwood home, we must determine some of your preferences.
Self-Monitored or Professionally Monitored?
Any home security system you pick will offer a selection of equipment including entry sensors, cameras, etc. The question is, do you actually want to self-monitor your system? If like 63.24% (2,843) of people in Downtown Lynnwood, you are a renter, you might prefer a self-monitored home security system. On the other hand, 36.76% or 1,652 of Downtown Lynnwood residents own their homes and may be more likely to consider a professionally monitored system to protect their property.
Whether you rent or buy, how well can you monitor your system on your own? For example, if you're one of the 68% of people who commute an average of 39 minutes to work in or around Downtown Lynnwood, can you immediately receive notifications on your phone, check cameras in meetings or while working, and call the police if needed?
If not, you might want a professionally monitored system where a company is available 24/7 to respond, whether on vacation or at work. Please see our comprehensive guide on the best home security systems for a complete comparison.
Self-Installed vs. Professional Installation
Most providers have great self-installation options, so if you're handy or tech-savvy, like the 5% of Downtown Lynnwood residents working in computer engineering and science, self-installation can be a great option.
Alternatively, when your security system is installed professionally, you can ensure that your equipment is placed correctly and will function without any problems. That peace of mind is valuable for people willing to spend the extra money.
Residents of Downtown Lynnwood tend to have a lower median household income than nearby neighborhoods, earning $58,831 annually. In addition, 28.8% of residents have a college degree or higher, compared to 32.9% in the United States.
If you're a homeowner, do you have more to protect? The median home value in Downtown Lynnwood is $468,432. Compared to the median home value in Lynnwood of $493,316, your home value will probably be lower. With their larger lots, single-family homes tend to be more isolated from view and a tempting target for burglars.
Find an in-depth review of installation options in our best home security systems guide.
Police Stations Near Downtown Lynnwood, Lynnwood, WA
There are 1 police stations within the boundaries of Downtown Lynnwood, and 15 within 5 miles. Within 50 miles of the Downtown Lynnwood center, there are 274 police stations. Compared to other neighborhoods, police response times in Downtown Lynnwood may be much faster. Even when response times are great, every second your security system saves in reporting a crime will improve the police response.
| City Of Lynnwood 19321 44th Avenue West Lynnwood, WA 98036 (425) 744-6900 ci.lynnwood.wa.us |
Washington State Police Athletic League 3333 164th St Sw Apartment 2227 Lynnwood, WA 98087 (206) 384-2244 |
Brier Police Department 2901 228th St Sw Lynnwood, WA 98036 (425) 775-5452 ci.brier.wa.us |
Home Security and Property Crime in Neighborhoods Near Downtown Lynnwood, Lynnwood, WA
Nearby Neighborhood | Property Crime Grade | Overall Crime Grade | Safer than Downtown Lynnwood, Lynnwood, WA? |
|---|---|---|---|
| Alderwood Manor, Lynnwood, WA | C | C- | more safe |
| Meadowdale, Lynnwood, WA | C | C | more safe |
| Filbert-Winesap, Bothell West, WA | C+ | C | more safe |
| Martha Lake, Lynnwood, WA | C- | D+ | more safe |
| Pinehurst, Everett, WA | C | C | more safe |
| Queensboro-Brentwood-Crystal Spgs, Bothell, WA | C+ | D+ | more safe |
| Thrasher's Corner-Red Hawk, Bothell, WA | C+ | B | more safe |
| Canyon Park, Bothell, WA | C+ | C- | more safe |
| Avondale, Everett, WA | C | C+ | more safe |
| North Creek, Bothell, WA | C | C | more safe |
Home Security and Property Crime in Neighborhoods Similar to Downtown Lynnwood, Lynnwood, WA
Nearby Neighborhood | Property Crime Grade | Overall Crime Grade | Safer than Downtown Lynnwood, Lynnwood, WA? |
|---|---|---|---|
| Corcoran, Minneapolis, MN | D | D | about as safe |
| Tevis Ranch, Bakersfield, CA | A+ | A+ | more safe |
| Downtown, Albuquerque, NM | D- | F | less safe |
| Milkhouse, Mobile, AL | A+ | A+ | more safe |
| Tuscan Lakes, League City, TX | A+ | A- | more safe |
| Cuesta Park, Mountain View, CA | B+ | A | more safe |
| Cottage Park, Mobile, AL | A+ | A+ | more safe |
| Cornerstone Village North, Houston, TX | F | D- | less safe |
| University-Syracuse, Syracuse, NY | C- | C- | more safe |
| Terra Vista, Bakersfield, CA | A+ | A+ | more safe |
Summarizing Home Security Considerations in Downtown Lynnwood, Lynnwood, WA
Deciding whether you need a home security system in Downtown Lynnwood, Lynnwood, WA can be a complicated decision. We've used distrinctive property crime statistics and varying environment factors about the neighborhood to help us make an objective recommendation for most residents. Leveraging CrimeGrade.org's uniquely robust and granular crime data, we've scrutinized the options for home security systems, tailoring them to the unique needs and context of Downtown Lynnwood residents.
Combining the property crime Grades, demographic information, and local climate conditions for advanced home security features gives us some companies that stand out.
Ring, ADT, and Simplisafe have emerged as the top choices for Downtown Lynnwood residents due to their distinctive offerings and reliability, each appealing to varied preferences and budget ranges of homeowners and renters alike. Notably, factors such as Downtown Lynnwood's climate, housing age, and average income levels further steer the home security considerations.
Property Crime Insights
- A property crime occurs approximately every 1 day 17 hours in Downtown Lynnwood.
- The neighborhood experiences 45.61 property crimes and 10.31 vandalism insidents per 1,000 people annually.
- Downtown Lynnwood's property crime grade stands at an 'D', comparably less safe than other Lynnwood {{place_type__plural_lower}}.
Noteworthy Security Companies
- Ring: We believe Ring is the best home security system for renters. 63% of residents in Downtown Lynnwood rent rather than own their homes. Additionally, the median income is $58,831, about comparable to the national average, therefore it is important that Ring is also affordable, with monitoring optional.
- ADT: Compelling history and top quality security and smart home products. If you're willing to pay for it, you will get a top notch product.
- Simplisafe: These guys offer the best all-round balance of equipment, monitoring, customer service, and price. They’re reliable and the keep your home safe—it’s a fairly comfortable #1 spot.
Climate Considerations for Security
- Freeze sensors might be worth considering, with December & January temperatures averaging 40.98 degrees.
- Flood sensors are also worth considering due to the 0.8" of average yearly rainfall and house age of 50 years.
Self vs. Professional Monitoring & Installation
- 63.24% of Downtown Lynnwood residents are renters, potentially inclining towards self-monitored systems.
- Given the 68% of commuters, professional monitoring might offer valuable peace of mind.
- Considering Downtown Lynnwood's lower household median income of $58,831 and 28.8% college-degree holding populace, investment in professional installation and advanced system features might be favorable.
Local Police Presence
- Downtown Lynnwood hosts 1 police stations within it's borders, potentially influencing response times.