Crime per Capita in Lee
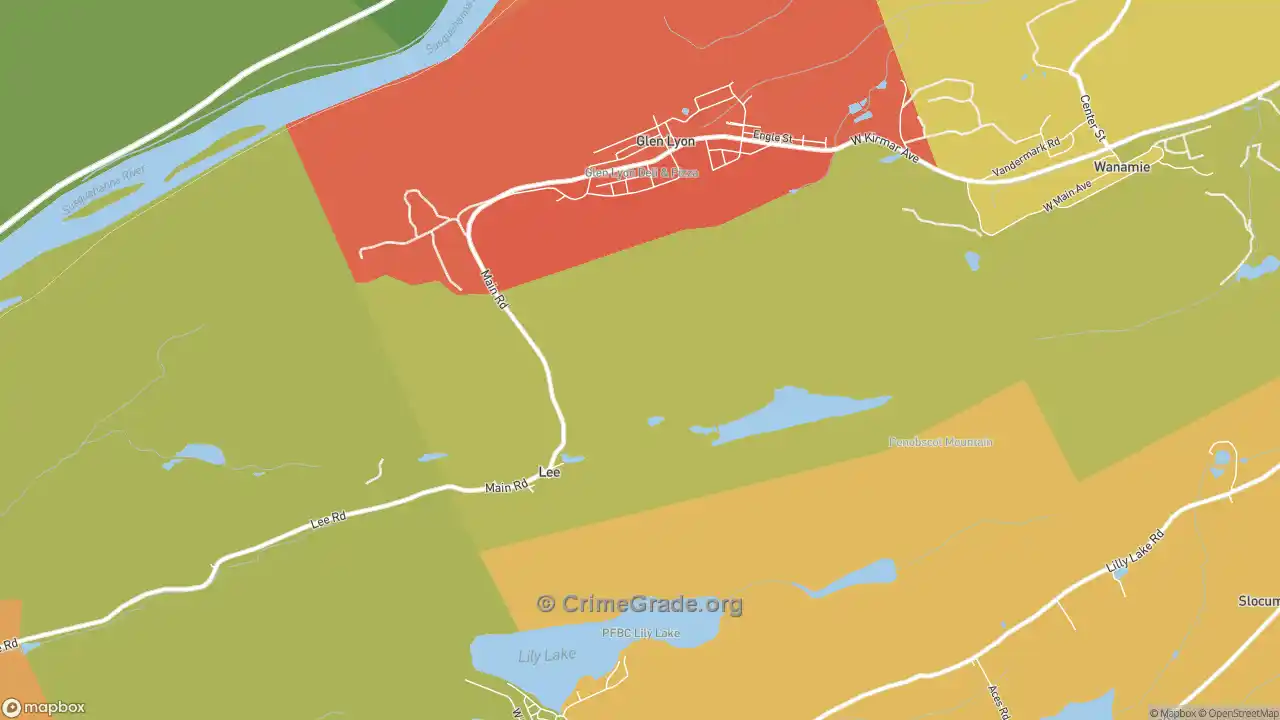
This overview combines violent, property, and other offenses into a single grade for Lee. The dedicated violent crime and property crime pages go deeper on each. The map below shows the overall crime rate per 1,000 residents.
This overview combines violent, property, and other offenses into a single grade for Lee. The dedicated violent crime and property crime pages go deeper on each. The map below shows the overall crime rate per 1,000 residents.
A-
Overall Crime Grade™
A+ |
|
B- |
|
Other Crime Grade |
A |
On the map, green marks the parts of Lee with the least crime overall and red marks the most. Each area is weighted by the type and severity of every offense, so a place with rare but serious violent crime can grade differently from one with frequent petty theft. The Interpreting the Crime Maps section below explains how to read the colors.
The A- overall grade blends the violent, property, and other grades shown above into one measure, set against the average US city, where Lee's combined rate is lower than the norm. Lee sits in the 80th percentile, ahead of 80% of cities and behind 20%. The grade covers only Lee's official city boundaries. See the table below for nearby cities.
The overall crime rate in Lee is 15.29 per 1,000 residents in a typical year.
| Lee, PA: | $264 |
|---|---|
| Duquesne, PA: | $1037 |
| Lewisberry, PA: | $119 |
| Pennsylvania: | $353 |
| USA: | $464 |
Crime |
Cost to Lee |
Cost per Lee Resident |
|---|---|---|
Murder |
$5,606 |
$125 |
Rape/Sexual Assault |
$1,158 |
$26 |
Robbery |
$674 |
$15 |
Assault |
$118 |
$3 |
Kidnapping |
$75 |
$2 |
Vehicle Theft |
$461 |
$10 |
Burglary |
$580 |
$13 |
Theft |
$2,032 |
$45 |
Arson |
$107 |
$2 |
Vandalism |
$567 |
$13 |
Animal Cruelty |
$13 |
$0 |
Drug Crimes |
$431 |
$10 |
Identity Theft |
$70 |
$2 |
Total Cost of Crime |
$11,894 |
$264 |
Crime rates on the map are measured per resident, so areas with heavy visitor traffic can read high because crime follows crowds, even where few people live. The city holds few retail establishments, which lifts recorded crime around those blocks. A red area does not always mean the neighborhood is unsafe for residents.
Airports, parks, and transit hubs create the same effect. Major airports draw large crowds with few residents nearby, so they read as high-crime spots. Parks and recreational areas do the same, and of Lee's 45 residents few live beside them. Before assuming an area is unsafe, weigh both the per-capita rate and the total number of incidents, and note what sits nearby.
The interactive maps load faster on a strong connection. Compare high speed internet in Lee, PA at ISP Reports.The tables below show which crimes are used to calculate the Crime Grades above. All crime rates are shown as the number of crimes per 1,000 Lee residents in a standard year.
Crime Type |
Crime Rate |
|---|---|
Assault |
0.0912 |
Robbery |
0.4764 |
Rape |
0.4246 |
Murder |
0.0663 |
Total Violent Crime |
1.058 (A+) |
Crime Type |
Crime Rate |
|---|---|
Theft |
8.721 |
Vehicle Theft |
0.6615 |
Burglary |
1.421 |
Arson |
0.0985 |
Total Property Crime |
10.90 (B-) |
Crime Type |
Crime Rate |
|---|---|
Kidnapping |
0.0276 |
Drug Crimes |
1.296 |
Vandalism |
1.764 |
Identity Theft |
0.2012 |
Animal Cruelty |
0.0394 |
Total "Other" Rate |
3.327 (A) |
Compared to surrounding cities, the rate of crime in Lee is similar. The table below shows Crime Grades for cities close to Lee.
Nearby City | Overall Crime Grade | Violent Crime Grade | Property Crime Grade |
|---|---|---|---|
C+ | D | C | |
A+ | B+ | A- | |
B+ | A | C+ | |
B+ | A- | B- | |
A+ | A+ | A | |
A+ | A+ | A | |
A+ | A+ | A- | |
B | B+ | C+ | |
A+ | A+ | A | |
A | A | B+ |
Lee is lower versus other cities of the same size for crime. The table below compares crime in cities with comparable overall population in the city‘s boundaries.
Similar City | Overall Crime Grade | Violent Crime Grade | Property Crime Grade |
|---|---|---|---|
D- | F | F | |
D | D- | D- | |
D- | D+ | D+ | |
D+ | C- | C- | |
D- | F | F | |
F | F | F | |
D | C | C | |
D | F | F | |
D- | D- | D- | |
B+ | C+ | C+ |
Considering only the crime rate, Lee is safer than the Pennsylvania state average and safer than the national average.
Safety and school performance are separate topics, but both shape moving decisions. Using SchoolGrade data, schools in Lee, PA average SchoolGrade of C+, with 40% actual proficiency versus 46% projected; overall, schools underperform expectations. See Lee schools on SchoolGrade
CrimeGrade.org provides highly detailed and accurate crime data, used by insurance companies, home security firms, and other industries. Our data is available for licensing—learn more about our USA crime data and licensing.
Our proprietary data is available for download by zip code or by state in a CSV Flat File. Please visit our download page for pricing and terms.
Download CSV
A crime occurs on average every year or more in Lee. Want to protect your home?
Home Security Companies in Lee, PA
All maps and statistics above are projections, not certainties, and provided without guarantee free of charge. Verify all info before making any decisions based on the data.