$533,712
Cost of Crime™ for Milnor, ND
In 2025, crime will cost $1,090 per household.
More cost data
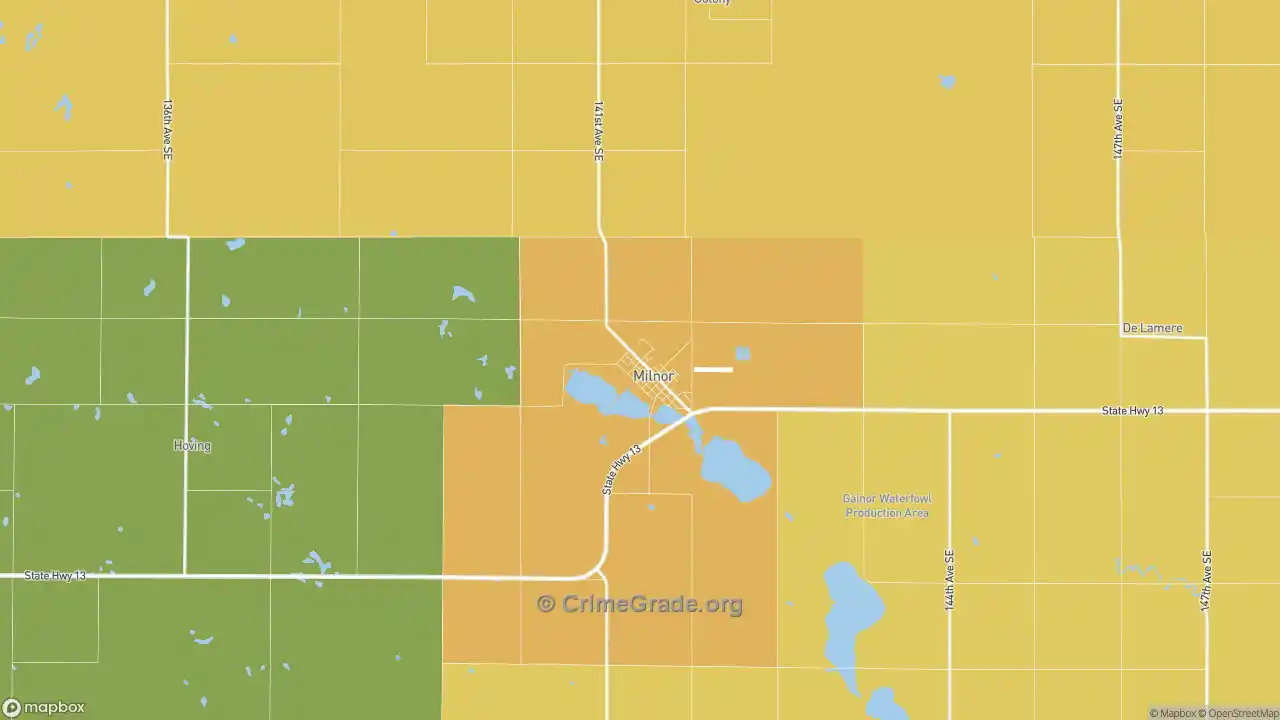
On the map, green marks the parts of Milnor with the least crime overall and red marks the most. Each area is weighted by the type and severity of every offense, so a place with rare but serious violent crime can grade differently from one with frequent petty theft. The Interpreting the Crime Maps section below explains how to read the colors.
Is Milnor, ND Safe?
The D+ overall grade blends the violent, property, and other grades shown above into one measure, set against the average US city, where Milnor's combined rate is higher than the norm. Milnor sits in the 24th percentile, ahead of 24% of cities and behind 76%. The grade covers only Milnor's official city boundaries. See the table below for nearby cities.
The overall crime rate in Milnor is 35.18 per 1,000 residents in a typical year. Residents generally consider the west part of the city the safest. Your chance of being a victim ranges from 1 in 25 in the central neighborhoods to 1 in 41 in the west.
Counting total incidents instead of per-capita rates, the central parts of Milnor, ND report the most crime, about 10 cases per year. The west part reports the fewest, around 0 per year.
The Cost of Crime™ in Milnor, ND
Across all crime types, the projected cost of crime in Milnor for 2025 is $533,712, about $491 per resident and $1,090 per household. That equals 1.2% of the median household income.
These figures cover tangible costs, which include:
- Criminal justice system costs (law enforcement, courts, and imprisonment): 59.7%
- Direct costs to victims (damaged property, medical expenses, and lost wages): 27.5%
- Lost economic contribution from offenders (time in prison or repeat offenses): 12.6%
How Much Does Crime Cost in Milnor Compared to Other Cities?
| Milnor, ND: |
$491
|
| Watford City, ND: |
$645
|
| Horace, ND: |
$263
|
| North Dakota: |
$485
|
| USA: |
$464
|
The overall cost of crime per resident in Milnor is $491 per year, which is $27 more than the national average and $6 more than North Dakota's state average. The comparison below uses cities similar to Milnor:
- In Watford City, ND, crime costs $645 per person, which is $154 more than in Milnor.
- In Horace, ND, crime costs $263 per person, which is $228 less than in Milnor
2025 Projected Cost by Type of Crime
The table below shows the total cost of crime to the residents of Milnor for the year 2025 along with the projected cost per resident.
Crime |
Cost to Milnor |
Cost per Milnor Resident |
Murder |
$86,614 |
$80 |
Rape/Sexual Assault |
$81,235 |
$75 |
Robbery |
$10,593 |
$10 |
Assault |
$98,178 |
$90 |
Kidnapping |
$12,134 |
$11 |
Vehicle Theft |
$38,299 |
$35 |
Burglary |
$28,431 |
$26 |
Theft |
$58,190 |
$54 |
Arson |
$3,870 |
$4 |
Vandalism |
$45,831 |
$42 |
Animal Cruelty |
$2,553 |
$2 |
Drug Crimes |
$63,208 |
$58 |
Identity Theft |
$4,577 |
$4 |
Total Cost of Crime |
$533,712 |
$491 |
The Intangible Cost of Crime in Milnor, ND
The totals above count tangible costs only. Violent crime also carries a human cost, the pain and trauma borne by victims and their families, which research-based methods estimate so it can be compared across places.
That intangible cost in Milnor totals $993,984 ($914 per resident), and all of it comes from
violent crime rather than property loss. Added to the tangible costs, the full estimate reaches $1,527,696 ($1,405 per resident).
All Cost of Crime figures come from scholarly research on the cost of crime.
Read more about our methodology here.
Interpreting the Crime Maps
Crime rates on the map are measured per resident, so areas with heavy visitor traffic can read high because crime follows crowds, even where few people live. The central part of the city holds more retail establishments, which lifts recorded crime around those blocks. A red area does not always mean the neighborhood is unsafe for residents.
Airports, parks, and transit hubs create the same effect. Major airports draw large crowds with few residents nearby, so they read as high-crime spots. Parks and recreational areas, of which Milnor has 2, do the same, and of Milnor's 1,087 residents few live beside them. Before assuming an area is unsafe, weigh both the per-capita rate and the total number of incidents, and note what sits nearby.
The interactive maps load faster on a strong connection. Compare
high speed internet in Milnor, ND at ISP Reports.
Milnor Crime Breakdown
The tables below show which crimes are used to calculate the Crime Grades above. All crime rates are shown as the number of crimes per 1,000 Milnor residents in a standard year.
Violent Crime Rates
Crime Type |
Crime Rate |
Assault |
3.145 |
Robbery |
0.3098 |
Rape |
1.233 |
Murder |
0.0424 |
Total Violent Crime |
4.730 (D) |
|
|
Property Crime Rates
Crime Type |
Crime Rate |
Theft |
10.34 |
Vehicle Theft |
2.275 |
Burglary |
2.884 |
Arson |
0.1474 |
Total Property Crime |
15.64 (C-) |
|
|
Other Crime Rates
Crime Type |
Crime Rate |
Kidnapping |
0.1841 |
Drug Crimes |
7.861 |
Vandalism |
5.902 |
Identity Theft |
0.5440 |
Animal Cruelty |
0.3175 |
Total "Other" Rate |
14.81 (D-) |
Individual Milnor Crime Maps & Stats
Crime Maps and Rates for Nearby Cities
Compared to surrounding cities, the rate of crime in Milnor is higher. The table below shows Crime Grades for cities close to Milnor.
Nearby City | Overall Crime Grade | Violent Crime Grade | Property Crime Grade |
|---|
| C | C | B- |
| C | D+ | B- |
| C- | C+ | C- |
| C | B- | B- |
| C+ | B+ | B |
| D+ | C | C |
| B | C+ | A+ |
| D | C | D |
| C | C | C+ |
| D+ | C- | C- |
Crime Maps and Rates for City with Similar Populations
Milnor is higher versus other cities of the same size for crime. The table below compares crime in cities with comparable overall population in the city‘s boundaries.
Similar City | Overall Crime Grade | Violent Crime Grade | Property Crime Grade |
|---|
| D- | D | D |
| C | C- | C- |
| C+ | B+ | B+ |
| B | A- | A- |
| B | C+ | C+ |
| C+ | C | C |
| A | A+ | A+ |
| A- | B+ | B+ |
| D | C+ | C+ |
| B | C | C |
Considering only the crime rate, Milnor is as safe as the North Dakota state average and less safe than the national average.
Safety and school performance are separate topics, but both shape moving decisions. Using SchoolGrade data, schools in Milnor, ND average SchoolGrade of B-, with 40% actual proficiency versus 37% projected; overall, schools exceed expectations. See Milnor schools on SchoolGrade
About the Data
CrimeGrade.org provides highly detailed and accurate crime data, used by insurance companies, home security firms, and other industries. Our data is available for licensing—learn more about our USA crime data and licensing.
Crime By Zip Code Download
Our proprietary data is available for download by zip code or by state in a CSV Flat File. Please visit our download page for pricing and terms.
Download CSV
Home Security
A crime occurs on average every 9 days 13 hours in Milnor. Want to protect your home?
Home Security Companies in Milnor, ND
All maps and statistics above are projections, not certainties, and provided without guarantee free of charge. Verify all info before making any decisions based on the data.