$680,020
Cost of Crime™ for Osceola Mills, PA
In 2025, violent crime will cost $628 per household.
More cost data
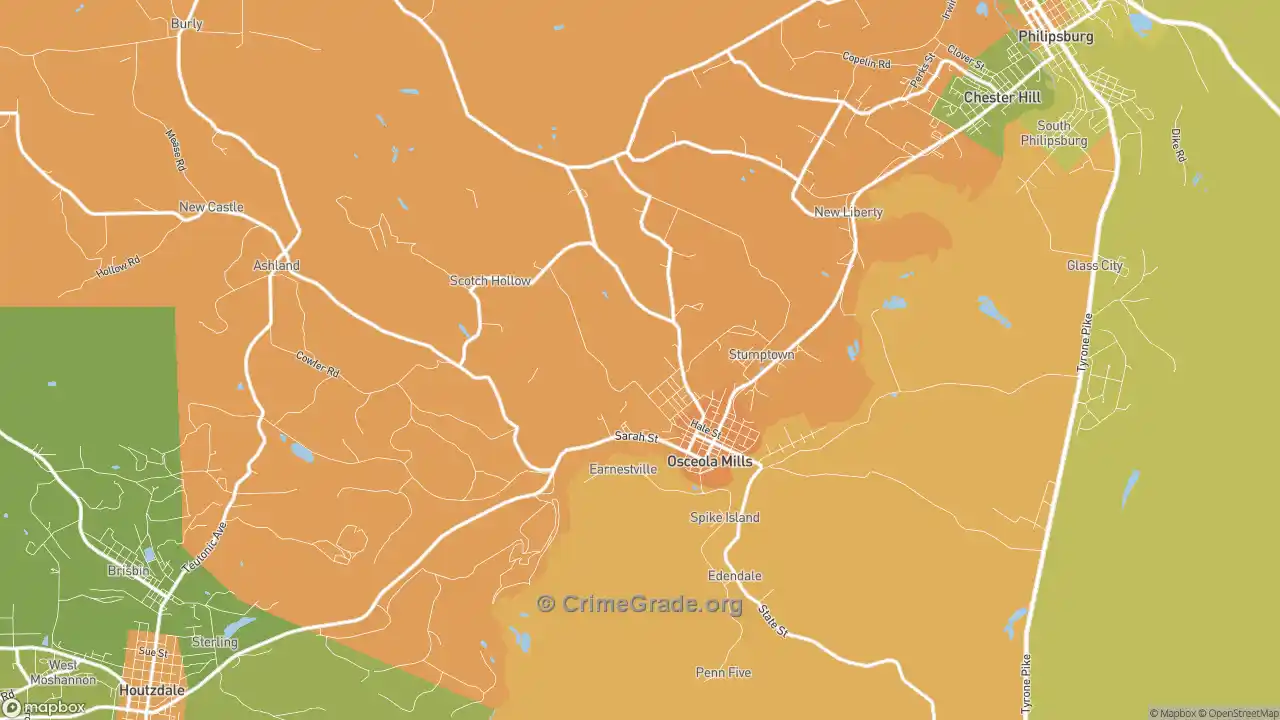
On the map, green marks the parts of Osceola Mills with the least violent crime and red marks the most, weighted by the type and severity of each offense. Violent crime concentrates where people gather after dark, near nightlife, bars, and transit, more than on residential streets. The Interpreting the Crime Maps section below explains how to read those hot spots.
The C+ grade reflects how often assault, robbery, rape, and murder occur in Osceola Mills against the average US city, where the rate is about the same as the norm. Osceola Mills sits in the 51st percentile for violent-crime safety, ahead of 51% of cities and behind 49%. The grade covers only Osceola Mills's official city boundaries. See the table below for nearby cities.
The violent crime rate in Osceola Mills is 2.854 per 1,000 residents in a typical year. Residents generally consider the central part of the city the safest. Your chance of being a victim ranges from 1 in 254 in the northeast neighborhoods to 1 in 658 in the central.
Counting total incidents instead of per-capita rates, the northwest parts of Osceola Mills, PA report the most violent crime, about 3 cases per year. The west part reports the fewest, around 0 per year.
The Cost of Crime™ in Osceola Mills, PA
The tangible cost of violent crime in Osceola Mills is projected at $680,020 for 2025, about $289 per resident and $628 per household. That equals 1.0% of the median household income, and it counts only the bills that can be totaled: emergency care, lost wages, and the justice response. The larger cost, the harm to victims, comes later on this page.
These tangible costs split into:
- Criminal justice system costs (law enforcement, courts, and imprisonment): 38.2%
- Direct costs to victims (damaged property, medical expenses, and lost wages): 48.7%
- Lost economic contribution from offenders (time in prison or repeat offenses): 13.0%
How Much Does Violent Crime Cost in Osceola Mills Compared to Other Cities?
| Osceola Mills, PA: |
$289
|
| Duquesne, PA: |
$795
|
| Lewisberry, PA: |
$69
|
| Pennsylvania: |
$227
|
| USA: |
$258
|
The tangible cost of violent crime is $289 per resident each year in Osceola Mills, which is $31 more than the national average and $62 more than Pennsylvania's state average. The comparison below uses cities similar to Osceola Mills:
- In Duquesne, PA, crime costs $795 per person, which is $506 more than in Osceola Mills.
- In Lewisberry, PA, crime costs $69 per person, which is $220 less than in Osceola Mills
2025 Projected Violent Crime Cost by Type
The table below breaks the violent-crime total into its four offenses for Osceola Mills, with the projected cost per resident.
Crime |
Cost to Osceola Mills |
Cost per Osceola Mills Resident |
Murder |
$459,566 |
$195 |
Rape/Sexual Assault |
$57,801 |
$25 |
Robbery |
$48,422 |
$21 |
Assault |
$114,231 |
$49 |
Total Cost of Violent Crime |
$680,020 |
$289 |
The Human Cost of Violent Crime in Osceola Mills, PA
Much of what violent crime costs never reaches a bill. Pain, trauma, and lost quality of life for victims and their families typically outweigh the medical and legal totals above. Research-based methods put a figure on that harm so it can be compared across places.
By those methods, the human cost of violent crime in Osceola Mills totals $3,371,976 ($1,433 per resident). Added to the tangible costs, the full estimate reaches $4,051,996 ($1,722 per resident). This human toll is what sets violent crime apart from
property crime in Osceola Mills, PA, where the loss is mostly replaceable property.
All Cost of Crime figures come from scholarly research on the cost of crime.
Read more about our methodology here.
Interpreting the Violent Crime Maps
Violent crime rates are measured per resident, so places packed with visitors after dark read high even when few people live there. Bars, clubs, event venues, and transit hubs draw the crowds where assaults and robberies cluster. How strongly this shows on the map depends on the commercial base; the southeast part of the city has more retail establishments. A red block full of bars and venues does not mean the homes around it are dangerous.
Transit stations show the same effect: large moving crowds, few residents, so per-capita violent crime reads high. Before judging a residential street, weigh both the per-capita rate and the total count of incidents, and note what draws crowds nearby.
The interactive maps load faster on a solid connection. Compare
high speed internet in Osceola Mills, PA at ISP Reports.
Osceola Mills Violent Crime Breakdown
The table below shows which offenses feed the Violent Crime Grade above, each as crimes per 1,000 Osceola Mills residents in a standard year.
Crime Type |
Crime Rate |
Assault |
1.690 |
Robbery |
0.6542 |
Rape |
0.4051 |
Murder |
0.1039 |
Total Violent Crime |
2.854 (C+) |
Individual Osceola Mills Crime Maps & Stats
Crime Maps and Rates for Nearby Cities
Compared to surrounding cities, the rate of violent crime in Osceola Mills is higher. The table below shows Crime Grades for cities close to Osceola Mills.
Nearby City | Overall Crime Grade | Violent Crime Grade | Property Crime Grade |
|---|
| C+ | C- | C- |
| C | C+ | D+ |
| A- | A+ | B- |
| B+ | B- | B+ |
| B | B | C |
| C+ | C | C- |
| C+ | B- | C- |
| C+ | B | C- |
| A- | A | B+ |
| A- | B- | B+ |
Crime Maps and Rates for City with Similar Populations
Osceola Mills is lower versus other cities of the same size for violent crime. The table below compares crime in cities with comparable overall population in the city‘s boundaries.
Similar City | Overall Crime Grade | Violent Crime Grade | Property Crime Grade |
|---|
| B+ | A- | A- |
| D- | F | F |
| A+ | A+ | A+ |
| B | C+ | C+ |
| B+ | B- | B- |
| C | C- | C- |
| C | C+ | C+ |
| C- | D+ | D+ |
| C+ | C+ | C+ |
| A+ | A+ | A+ |
Considering only the violent crime rate, Osceola Mills is less safe than the Pennsylvania state average and safer than the national average.
About the Data
CrimeGrade.org provides highly detailed and accurate crime data, used by insurance companies, home security firms, and other industries. Our data is available for licensing—learn more about our USA crime data and licensing.
Crime By Zip Code Download
Our proprietary data is available for download by zip code or by state in a CSV Flat File. Please visit our download page for pricing and terms.
Download CSV
Home Security
A crime occurs on average every 6 days 17 hours in Osceola Mills. Want to protect your home?
Home Security Companies in Osceola Mills, PA
All maps and statistics above are projections, not certainties, and provided without guarantee free of charge. Verify all info before making any decisions based on the data.