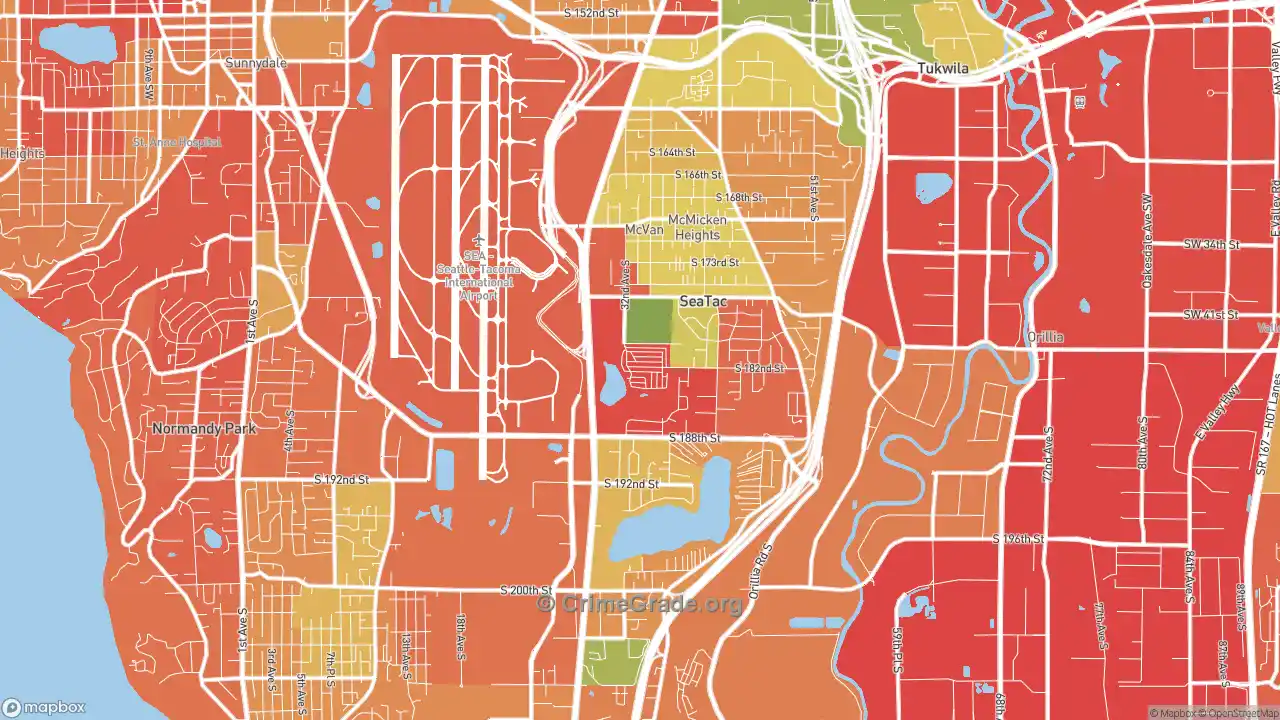
SeaTac is a city of 34,200 in King County, about 11 miles south of downtown Seattle · Updated November 2026
How common is property crime in SeaTac?
Property crime is high in SeaTac: a C-, with more property crime than the neighborhoods where 83% of Americans live. Theft makes up 43% of it. Burglary, the crime most likely to reach into a home, grades B, and vehicle theft grades F.
C-
Property crime CrimeGrade™
Safety score 384 of 1,000More property crime than most US neighborhoodsi What this means
17% of Americans live in neighborhoods with more property crime than SeaTac as a whole, and 83% in neighborhoods with less. The typical US neighborhood has a property crime safety score of 823, a CrimeGrade™ of A-. SeaTac scores 384.
Crime is concentrated in a small share of places, so most neighborhoods score high on the 0 to 1,000 scale. That is why a score in the 800s can still mean more property crime than most US neighborhoods.
How to read the map: each area's color compares its property crime with the homes, parked cars and people there, on one national scale, from green for the least to red for the most. Each area gets its own color, so a busy shopping center can show red while the homes beside it stay green. The interactive maps load faster on a strong connection. Compare high speed internet in SeaTac, WA at ISP Reports.
Who this page is for: homeowners and renters in SeaTac, and anyone thinking about buying or renting a home there.
Business and enterprise customers: this free map shows neighborhood areas. CrimeGrade™ business reports map crime at about 66-meter detail and estimate it for one address and type of business. See business reports
What stands out about property crime in SeaTac
Vehicle theft at more than triple the US rate. SeaTac has 13.0 car thefts a year per 1,000 residents, against 2.7 nationally.
Thefts from cars happen at stores and businesses far more often than nationally. In SeaTac, 43% of reported thefts from cars happen at stores and businesses, against 10% nationally.
Where property crime is lowest and highest in SeaTac
High property crime is widespread across SeaTac: 68% of residents live in areas graded D or F, and 13% in areas graded A or B. Property crime grades across SeaTac run from B to F.
13%19%68%
A or B 13%C 19%D or F 68%
Share of residents, by the property crime CrimeGrade™ of the area they live in.
Is property crime going up in SeaTac?
Reported property crime in SeaTac peaked in 2021 and has fallen 32% since, back near its 2019 level. Burglaries, thefts and vehicle thefts went from about 38 to 37 a year per 1,000 residents (US: 18). In 2024 alone, property crime fell 22%.
Property crime, change since 2019
SeaTacUnited States
Source: crime reports to the FBI from the police department that serves SeaTac. The charts follow crimes per resident.
Data table
Year
Property, SeaTac
Property, US
2016
+44%
+15%
2017
+35%
+12%
2018
+27%
+4%
2019
+0%
+0%
2020
+17%
-8%
2021
+44%
-10%
2022
+30%
-6%
2023
+25%
-7%
2024
-2%
-15%
Property crime rates and types in SeaTac
CrimeGrade™ estimates SeaTac has about 46 reported property crimes a year for every 1,000 residents, 95% more than the US as a whole and 36% more than Washington.
All property crime
Burglary
Vehicle theft
Reported crimes a year, per 1,000 residents. Property crime here includes vandalism, which the FBI's property crime rate leaves out.
Theft is the most common property crime in SeaTac, about 43% of the total, followed by vehicle theft and vandalism.
Each CrimeGrade™ here compares a property crime with what it affects: homes for burglary and arson, parked cars for vehicle theft, people and parking for theft, homes and businesses for vandalism. Rates count crimes per 1,000 residents.
The Seatac Police Department's 2024 report of burglary had a month far out of line with the rest, a sign of a data-entry error or a catch-up month, so CrimeGrade™ set it aside and used the other months.
Select a crime's name to see its map above. CrimeGrade™ business reports map each crime at about 66-meter detail.
Where and when property crime happens in SeaTac
SeaTac has its own police department, and these figures come from its reports, 2022 to 2024.
In SeaTac, 47% of burglaries hit homes, against 57% nationally. Car thefts happen most often at homes: 41% of them, against 33% nationally.
Crime
Most often at
Busiest time
Burglary
Homes (47%)
Morning (6 am to noon)
Car theft
Homes (41%)
Morning (6 am to noon)
Theft from cars
Stores and businesses (43%)
Morning (6 am to noon)
Vandalism
Homes (36%)
Evening (6 pm to midnight)
Shares of the crimes reported to police, 2022 to 2024. Reports with no time recorded are left out of the times.
Property crime in SeaTac and nearby cities
SeaTac has less property crime than 8 of its 10 nearest cities; only Normandy Park and East Hill-Meridian have less.
Among the traits that tend to go with property crime, two set SeaTac apart: it has 129 jobs for every 100 residents, against 45 for the US as a whole, and 41 buses and trains an hour at the evening rush, where most Americans have none nearby. Places with both tend to report more theft than places with only one of them; here theft sits near the national middle.
JobsJobs draw daytime crowds. Places with many jobs tend to report more theft.129 for every 100 residentsUS: 45Higher than for 98% of US city residents
Transit serviceBuses and trains an hour at the evening rush. Places with busy transit tend to report more theft. BestNeighborhood's Transit Grade for SeaTac: C- (32 of 100).41 trips an hourUS: noneHigher than for 96% of US city residents
Walk GradeBestNeighborhood's grade for getting through daily life on foot, traced along real walking routes to shops, schools and parks. Walkable places tend to report more theft. 84% of residents here live in car-dependent areas.D (18 of 100)US: 21Higher than for 52% of US city residents
Show all 6
Lit at nightSatellite images show which neighborhoods are lit at night, a sign of busy streets and businesses. Brightly lit places tend to report more theft and vandalism.100% where people liveUS: 78%Higher than for 92% of US city residents
Residents in dense blocksBlocks of 10,000 or more people per square mile. Dense neighborhoods tend to report more car theft.42% of residentsUS: 24%Higher than for 78% of US city residents
Stores and restaurantsShops and restaurants draw crowds and parked cars. Places with many stores tend to report more theft.8.0 per 1,000 residentsUS: 10.5Lower than for 73% of US city residents
BestNeighborhood, a sister site of CrimeGrade™, ranks the neighborhoods of SeaTac on shops, parks, home prices, getting around and more.
These traits tend to go with more or less crime; none of them causes it on its own. Sources: Census job counts and housing figures, OpenStreetMap and Overture business listings, CrimeGrade™ parking estimates, NASA night-light imagery, US Forest Service tree cover, EPA transit data and BestNeighborhood's Walk Grade.
What property crime costs SeaTac
Property crime costs SeaTac about $14 million a year, or $407 per resident and about $1,181 per household: the value of what is stolen or damaged, plus the police, courts and prisons that respond.
Cost of property crime per resident, per year
How the cost breaks down
Pain and suffering add little to the cost of property crime, so this is close to its full cost.
Crime
Cost a year
Per resident
Burglary
$1.1 million
$32
Theft
$3.5 million
$102
Vehicle theft
$6.8 million
$200
Arson
$160,000
$5
Vandalism
$2.3 million
$69
Total
$14 million
$407
How CrimeGrade™ works
The property crime CrimeGrade™ covers burglary, theft, car theft, arson and vandalism, from A+ for the least crime to F for the most, on one scale for the whole country.
It weighs each property crime against what it affects: homes for burglary and arson, parked cars for car theft, and the people and parking around stores for theft.
The rates on this page count crimes for every 1,000 people who live here, the way police departments report them.
Comparisons with US neighborhoods use the Census Bureau's block groups, small areas of about 1,400 residents, and count the people who live in each. The figures count crimes reported to police; many crimes, shoplifting above all, never are. Behind the grades, CrimeGrade™ tested 21,607 factors from 125 data families. For business owners, paid CrimeGrade™ location reports estimate crime at a single address for each type of business.
Where the numbers come from
Crime reports that police departments file with the FBI
State crime records and city crime data, where they are published
Published research on what crime costs victims and communities
These are estimates of reported crime for whole areas, not a record of what happened on any one street. CrimeGrade™ updates them once a year and provides them free and without guarantee. Check local sources before you rely on them for a decision.