The El Paso metro area, the 67th-largest in the US, is home to 874,200 residents · Updated November 2026
How common is violent crime in the El Paso area?
Violent crime in the El Paso area runs higher than in most US neighborhoods: an A-, with more violent crime than the neighborhoods where 61% of Americans live. Assaults make up 95% of it, and most of those are simple assaults, which involve no weapon and no serious injury. The city of El Paso itself grades A- for violent crime.
A-
Violent crime CrimeGrade™
Safety score 805 of 1,000More violent crime than most US neighborhoodsi What this means
39% of Americans live in neighborhoods with more violent crime than the El Paso area as a whole, and 61% in neighborhoods with less. The typical US neighborhood has a violent crime safety score of 860, a CrimeGrade™ of A. The El Paso area scores 805.
Crime is concentrated in a small share of places, so most neighborhoods score high on the 0 to 1,000 scale. That is why a score in the 800s can still mean more violent crime than most US neighborhoods.
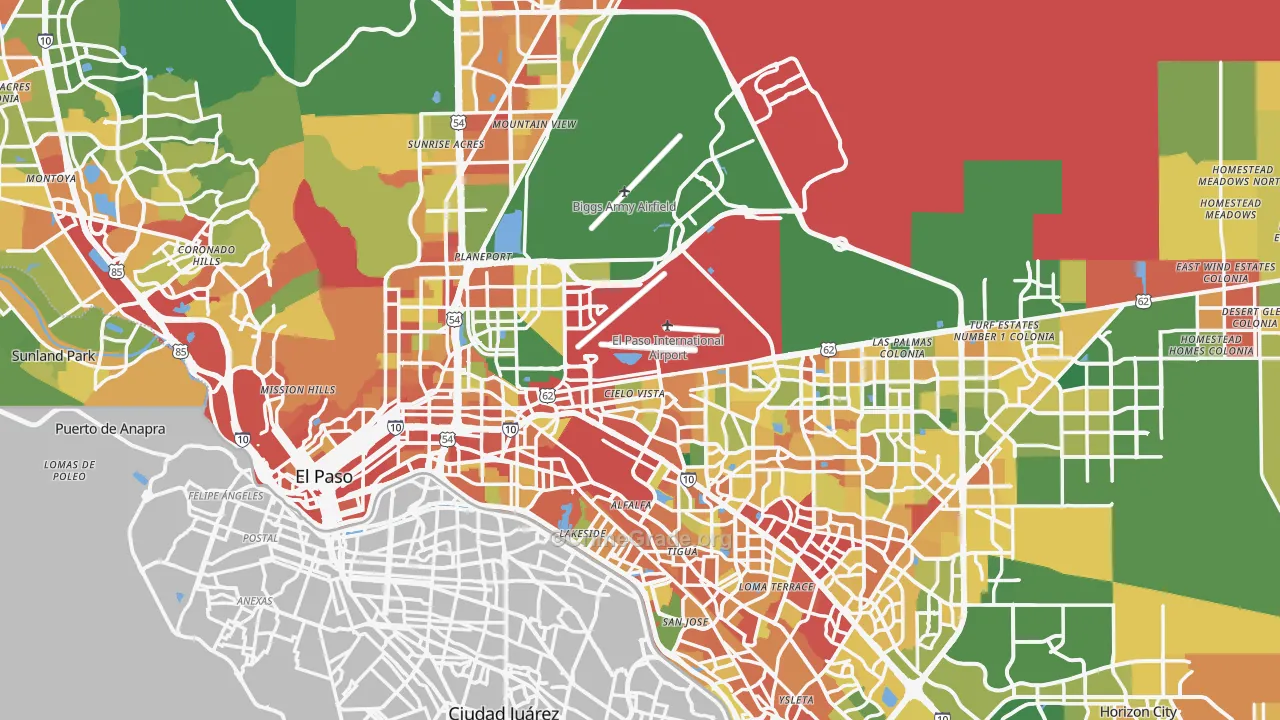
How to read the map: each area's color compares its violent crime with the people who spend time there, on one national scale, from green for the least to red for the most. Each area gets its own color, so a busy downtown or nightlife strip can show red while the homes around it stay green. The interactive maps load faster on a solid connection. Compare high speed internet in El Paso, TX at ISP Reports.
Who this page is for: homeowners and renters in the El Paso area, and anyone thinking about buying or renting a home there.
Business and enterprise customers: this free map shows neighborhood areas. CrimeGrade™ business reports map crime at about 66-meter detail and estimate it for one address and type of business. See business reports
What stands out about violent crime in the El Paso area
Aggravated assaults run high in Sunset Heights. In this part of southwest El Paso, they run at more than double the rate in the rest of El Paso.
Robbery runs low. The El Paso area has 0.33 robberies a year per 1,000 residents, about half the US rate of 0.62.
Where violent crime is lowest and highest in the El Paso area
Low violent crime is the norm across the El Paso area: 96% of residents live in areas graded A or B, and 1% in areas graded D or F. Violent crime grades across the El Paso area run from A+ to D.
96%
A or B 96%C 3%D or F 1%
Share of residents, by the violent crime CrimeGrade™ of the area they live in.
Neighborhoods of El Paso
1Northwest, northwestAggravated assaults run about 30% lower here than in the rest of El Paso.A-842
2Las Tierras, eastAggravated assaults run about 30% lower here than in the rest of El Paso.A-808
3East Side, southeastRobberies run about 20% lower here than in the rest of El Paso.A-788
4Album Park & Cielo Vista South, centralRobberies run about 40% lower here than in the rest of El Paso.B+766
5Northeast, northRobberies run about 90% higher here than in the rest of El Paso.B+761
7Central, westAggravated assaults run about 70% higher here than in the rest of El Paso.B634
8Sunset Heights, southwestSimple assaults run at about triple the rate in the rest of El Paso.C461
Neighborhood areas of the city of El Paso, ranked by violent crime CrimeGrade™; beside each grade is its safety score, from 0 to 1,000 (higher is safer). Each one combines several of the smaller areas on the map.
Cities and towns in the El Paso metro area with at least 1,000 residents. Ranked by violent crime CrimeGrade™; beside each grade is its safety score, from 0 to 1,000 (higher is safer), and the other numbers are residents.
Is violent crime going up in the El Paso area?
Reported violent crime in the El Paso area has fallen 21% since 2019. Murders, rapes, robberies and aggravated assaults went from about 3.4 to 2.7 a year per 1,000 residents (US: 3.7). In 2024 alone, violent crime fell 10%.
Violent crime, change since 2019
El Paso areaUnited States
Source: crime reports to the FBI from the police departments across the El Paso area. The charts follow crimes per resident.
Data table
Year
Violent, El Paso area
Violent, US
2016
+8%
+4%
2017
+6%
+4%
2018
+2%
+0%
2019
+0%
+0%
2020
-10%
+4%
2021
-25%
+6%
2022
-10%
+5%
2023
-12%
+2%
2024
-21%
-4%
Violent crime rates and types in the El Paso area
CrimeGrade™ estimates the El Paso area has about 15 reported violent crimes a year for every 1,000 residents, 13% more than the US as a whole and close to Texas.
All violent crime
Assaults
Robbery
Reported crimes a year, per 1,000 residents. Violent crime here includes simple assaults, which the FBI's violent crime rate leaves out.
Assault is the most common violent crime in the El Paso area, about 95% of the total.
Each CrimeGrade™ here compares a violent crime with the people who spend time in an area, not only the people who live there. Rates count crimes per 1,000 residents.
Select a crime's name to see its map above. CrimeGrade™ business reports map each crime at about 66-meter detail.
Where and when violent crime happens in the El Paso area
These figures come from the reports of the police departments across the El Paso area, 2022 to 2024.
In the El Paso area, 49% of aggravated assaults happen at a home, against 53% nationally. Robberies happen most often at stores and businesses: 39% of them.
Crime
Most often at
Busiest time
Robbery
Stores and businesses (39%)
Evening (6 pm to midnight)
Aggravated assault
Homes (49%)
Evening (6 pm to midnight)
Shares of the crimes reported to police, 2022 to 2024. Reports with no time recorded are left out of the times.
Violent crime in the El Paso area and nearby metro areas
The El Paso area has the least violent crime of its 10 nearest metro areas.
Nearest first, with each place's distance from the El Paso area. Beside each violent crime CrimeGrade™ is its safety score, from 0 to 1,000 (higher is safer).
Compared with metro areas of similar size and density, the El Paso area has more violent crime than 54% of them.
The El Paso area looks like a typical metro area on the traits that tend to go with violent crime.
Residents in dense blocksBlocks of 10,000 or more people per square mile. Dense neighborhoods tend to report more robbery.28% of residentsUS: 24%Higher than for 61% of Americans in metro areas
Transit serviceBuses and trains an hour at the evening rush. Places with busy transit tend to report more robbery. BestNeighborhood's Transit Grade for the El Paso area: D (13 of 100).4 trips an hourUS: noneHigher than for 56% of Americans in metro areas
These traits tend to go with more or less crime; none of them causes it on its own. Sources: Census job counts and housing figures, OpenStreetMap and Overture business listings, CrimeGrade™ parking estimates, NASA night-light imagery, US Forest Service tree cover, EPA transit data and BestNeighborhood's Walk Grade.
What violent crime costs the El Paso area
Counting the pain and suffering of victims, violent crime costs the El Paso area about $920 million a year, or $1,052 per resident. The costs that reach a bill, such as medical care, lost work and the justice system, come to about $219 million, or $251 per resident.
Billed cost of violent crime per resident, per year
How the cost breaks down
Pain and suffering are about 76% of that full cost.
Crime
Cost a year
Per resident
Murder
$57 million
$65
Rape
$20 million
$23
Robbery
$8.9 million
$10
Assault
$133 million
$153
Total
$219 million
$251
How CrimeGrade™ works
The violent crime CrimeGrade™ covers murder, rape, robbery and assault, from A+ for the least crime to F for the most, on one scale for the whole country.
It weighs each violent crime against the people who spend time in an area, so a busy downtown is graded on its workers and visitors as well as its residents.
The rates on this page count crimes for every 1,000 people who live here, the way police departments report them.
Comparisons with US neighborhoods use the Census Bureau's block groups, small areas of about 1,400 residents, and count the people who live in each. These figures cover the whole El Paso metro area. The figures count crimes reported to police; many crimes, shoplifting above all, never are. Behind the grades, CrimeGrade™ tested 21,607 factors from 125 data families. For business owners, paid CrimeGrade™ location reports estimate crime at a single address for each type of business.
Where the numbers come from
Crime reports that police departments file with the FBI
State crime records and city crime data, where they are published
Published research on what crime costs victims and communities
These are estimates of reported crime for whole areas, not a record of what happened on any one street. CrimeGrade™ updates them once a year and provides them free and without guarantee. Check local sources before you rely on them for a decision.