Assault per Capita in Manhattan Beach
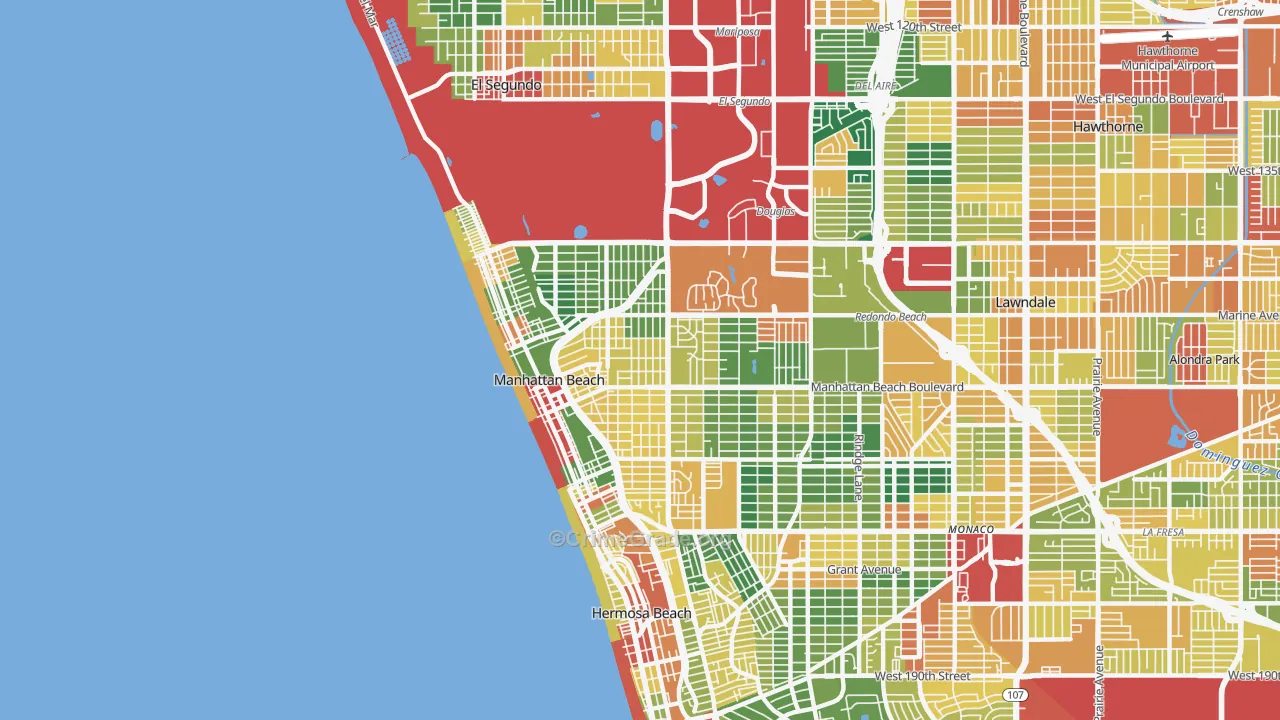
The map below shows assault per 1,000 Manhattan Beach residents.

The map below shows assault per 1,000 Manhattan Beach residents.
C-
Assault Grade™
D |
|
D+ |
|
D- |
Your yearly chance of being a victim of assault in Manhattan Beach is about 1 in 400.
Assault costs the average Manhattan Beach resident about $72 per year.
Crime Grade's assault map shows the safest places in Manhattan Beach in green. The most dangerous areas in Manhattan Beach are in red, with moderately safe areas in yellow. Crime rates on the map are weighted by the type and severity of the crime.
The C- grade means the rate of assault is slightly higher than the average US city. Manhattan Beach is in the 31st percentile for safety, meaning 69% of cities are safer and 31% of cities are more dangerous. This analysis applies to Manhattan Beach's proper boundaries only. See the table on nearby places below for nearby cities.
The rate of assault in Manhattan Beach is 2.501 per 1,000 residents during a standard year. People who live in Manhattan Beach generally consider the north part of the city to be the safest.
Your chance of being a victim of assault in Manhattan Beach may be as high as 1 in 53 in the southwest neighborhoods, or as low as 1 in 864 in the north part of the city.
By a simple count ignoring population, more assault occurs in the east parts of Manhattan Beach, CA: about 16 per year. The southwest part of Manhattan Beach has fewer cases of assault with only 1 in a typical year.
The chart below compares the assault rate in Manhattan Beach to the California state average and the national average. All rates are the number of crimes per 1,000 residents in a standard year.
| Manhattan Beach, CA: | 2.501 |
|---|---|
| California: | 3.228 |
| USA: | 2.561 |
Considering only the assault rate, Manhattan Beach is safer than the California state average and as safe as the national average.
See how CrimeGrade calculates these grades and rates on the CrimeGrade methodology page.
Assault is projected to cost the residents of Manhattan Beach about $2,646,620 in 2025, or roughly $72 per resident. This is part of Manhattan Beach's overall Cost of Crime™. See the full cost-of-crime breakdown for Manhattan Beach, including every crime type and how Manhattan Beach compares to other cities.
Remember that assault rates are measured per resident. Places with heavy daytime traffic, like shopping districts, airports, and parks, can look more dangerous than they are for the people who live there. See a full guide to reading Manhattan Beach's crime maps on the Manhattan Beach overall crime page.
To better understand and navigate these intricate crime maps, a high-speed internet connection can be crucial. Fast and seamless online connectivity ensures that map details load efficiently, providing users with clearer, uninterrupted insights. If you're considering enhancing your online experience, check out high speed internet in Manhattan Beach, CA at ISP Reports.Compared to surrounding cities, the rate of assault in Manhattan Beach is lower. The table below shows Crime Grades for cities close to Manhattan Beach.
Nearby City | Overall Crime Grade | Violent Crime Grade | Property Crime Grade | Assault Crime Grade |
|---|---|---|---|---|
D- | D | F | D | |
D+ | D+ | D | D+ | |
B- | C | C- | C | |
C- | D+ | D+ | D+ | |
D | D+ | D- | C- | |
C | D | D+ | D | |
D+ | D | D | D | |
D+ | D+ | D- | D+ | |
C- | C- | D | C | |
D | D- | D- | D |
Manhattan Beach is similar versus other cities of the same size for assault. The table below compares assault in cities with comparable overall population.
Similar City | Overall Crime Grade | Violent Crime Grade | Property Crime Grade | Assault Crime Grade |
|---|---|---|---|---|
D+ | C- | C- | C | |
A- | A- | A- | B+ | |
C- | D | D | D | |
F | F | F | F | |
C- | D+ | D+ | D+ | |
B+ | C | C | C- | |
B+ | C+ | C+ | C+ | |
A- | B+ | B+ | B+ | |
C | C- | C- | C- | |
A | B | B | B- |
Safety and school performance are separate topics, but both shape moving decisions. Using SchoolGrade data, schools in Manhattan Beach, CA average SchoolGrade of B-, with 43% actual proficiency versus 47% projected; overall, schools don't meet expectations. See Manhattan Beach schools on SchoolGrade
CrimeGrade.org provides highly detailed and accurate crime data, used by insurance companies, home security firms, and other industries. Our data is available for licensing—learn more about our USA crime data and licensing.
Our proprietary data is available for download by zip code or by state in a CSV Flat File. Please visit our download page for pricing and terms.
Download CSV
A assault occurs on average every 4.0 days in Manhattan Beach. Your home is 300% more likely to be robbed with no home security system. Want to protect your home?
Home Security Companies in Manhattan Beach, CA
All maps and statistics above are projections, not certainties, and provided without guarantee free of charge. Verify all info before making any decisions based on the data.